Causal attribution in an era of big time-series data
by KAY BRODERSEN
For the first time in the history of statistics, recent innovations in big data might allow us to estimate fine-grained causal effects, automatically and at scale. But the analytical challenges are substantial.
Observational techniques allow us to estimate counterfactuals in the absence of an experiment, provided that we can convincingly control for other factors that might explain an observed effect. Propensity scores, instrumental variables, and synthetic controls are all methods for estimating counterfactuals when randomized treatment is not an option.
Setting aside their statistical intricacies, randomized experiments and observational approaches generally work well in the world of small data, where we can reason about modeling assumptions and inspect our data visually. Today's reality, however, is a world of big data. It's a challenge and a promising opportunity — the availability of large amounts of data holding enormous value if only we had a key to make sense of them. Causal inference at scale may be one such key.
What if app developers could understand which new features drive downloads? If YouTube creators could see which videos lead to most subscriptions? If advertisers could measure which campaigns or creatives simply don't work? What if causal inference, whether based on experiments or based on observational data, wasn't limited to small-sample counterfactuals but could be carried out at scale?
Two things limit the application of our existing algorithms. First, how can we design causal methods that work at high levels of automation? And second, how do we extend our models to accomplish fine-grained attribution at scale? Let's take a look at both challenges.
Traditionally, estimating causal effects tends to involve a lengthy thought process. Is a randomized experiment possible? If not, can we use observational data while effectively controlling for confounders? The statistical methods for estimating counterfactuals are fairly well-developed and have been described in an extensive literature (see Rubin, Pearl, Angrist & Pischke, or Imbens & Rubin for recent examples). But automating such analyses is new territory. How do we decide on the best approach, build models, run power analyses and diagnostics, check the sensitivity of our results, and take action, all automatically and across millions or billions of instances?
It's a long-term research program in its early stages. One example of the steps we've taken at Google has been the development of CausalImpact, a synthetic-matching approach to automatically estimating causal effects from time-series data when a randomized experiment is not available. The model underlying CausalImpact is a structural time-series model, that is, a state-space model for time-series data. Like all state-space models, it rests on two simple equations:
\[y_t = Z^T_t \alpha_t + \varepsilon_t \\
\alpha_{t+1} = T_t \alpha_t+R_t \eta_t \]
The first equation expresses the observed data $y$ in terms of a linear combination of latent states plus observation noise. The second equation describes how these latent states evolve over time. Incredibly rich models can be formulated using these two equations alone (see here for details).
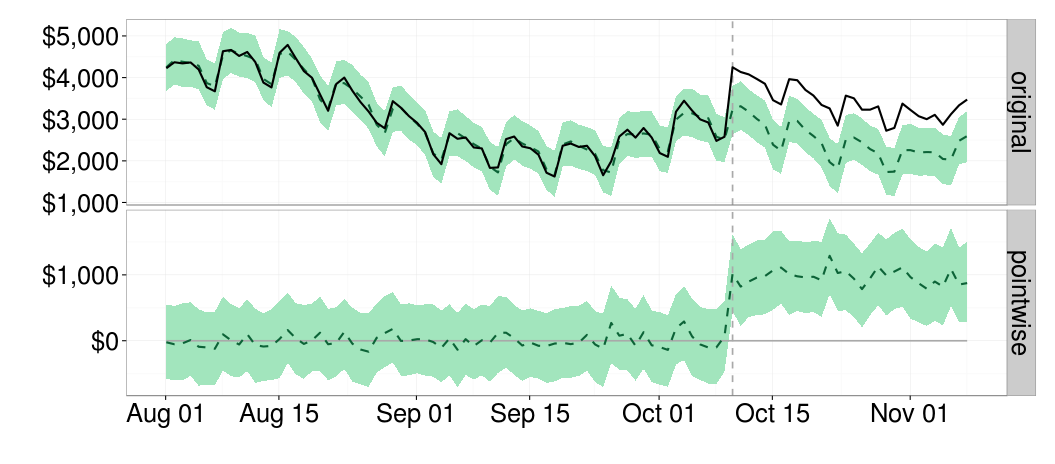
How do we get from state-space dynamics to causal inference? By letting the model predict what would have happened in the past had we not launched that new feature. Had we not rolled out that new product to more countries. Had we not launched that new app. The figure below illustrates this. The vertical dotted line marks the beginning of our intervention. By subtracting what the model predicts in hindsight, $\hat{y}_t$ (dotted line in the top panel), from what we actually observed, $y_t$ (solid line in the top panel), we obtain an estimate of the effect our actions caused (bottom panel).
CausalImpact adopts a Bayesian approach. A spike-and-slab prior allows the model to select a suitable subset of covariates without overfitting the data, especially in problems of high cardinality. And the conservative random-walk behavior of the state variables is suitable for a wide variety of time series that automated systems may encounter, as long as we are confident that the conditions for obtaining valid causal estimates are satisfied. For example, the covariates must not themselves have been affected by the intervention, and the relationship between the outcome variable and the covariates must be stable over time. These are examples of the things we need to get right as we move towards automation in causal inference.
There is, however, a second challenge besides automation. Randomized experiments and observational studies are typically designed to understand individual interventions — a feature launch, an advertising campaign, a video upload. In contrast, the data we would like to make sense of increasingly consists of massive streams of events and outcomes. Given a website visit, for example, we can no longer think of the 'last click' as the underlying causal event — a user might have visited the site anyway. Rather, we'll need to design models that attribute causal credit to a whole number of events, the combination of which led to the eventual outcome.
One prerequisite to fine-grained attribution is to measure outcomes more exhaustively than we have until more recently, for example through cross-device and offline conversions. But another task is to actually distribute credit to the underlying causative events. To take an analogy, the last move is rarely by itself causal for winning a game of chess. It's a whole sequence of steps that deserve credit (or blame). When each particular combination of events leading up to a user action is rare, though, we are dealing with incredibly sparse big data. Fine-grained attribution has been a persistent analytical headache, indicating that we have a long way to go in terms of making big data broadly useful in causal inference.
What would we gain from solving automatic and fine-grained causal inference? The answer is straightforward — a way of determining just how much each impression, click, or download contributed to the desired outcome, such as a website visit, an app download, or an account sign-up. A way of assessing, therefore, how much value each of these events provided, and to suggest how limited resources should be spent to provide the highest marginal return.
In a world of big data, our ambition is no longer to answer just one causal question. We want to solve all attribution problems — every day, instantly. We might well learn more about causality at scale in the next 10 years than we have in the past 100. And witness the emergence of new data science paradigms along the way.
For the first time in the history of statistics, recent innovations in big data might allow us to estimate fine-grained causal effects, automatically and at scale. But the analytical challenges are substantial.
Every idea at Google begins with a simple question. How can we predict the benefits the idea's realization would create for users, publishers, developers, or advertisers? How can we establish that there is a causal link between our idea and the outcome metric we care about? Revealing one causal law can be more powerful than describing a thousand correlations — since only a causal relationship enables us to understand the true consequences of our actions. It's why estimating causal effects has been at the heart of data science. Analyses might begin by exploring, visualizing, correlating. But ultimately, we'll often want to identify the drivers that determine why things are the way they are.
The golden path to estimating a causal effect is through a randomized experiment. For example, to find out whether a particular change to our search-ranking algorithm produces more relevant results, we might run a certain set of queries through the new algorithm while leaving others at the status quo. Neyman's and Rubin's potential outcomes provide a useful framework for thinking about such experiments. Using the ideas of regression or imputation, the control group allows us to obtain an unbiased estimate of the counterfactual — what would have happened to the set of treated queries had they not been treated.
At Google, we run many such experiments around the clock, in a layered system that allows us to test hundreds of ideas simultaneously without introducing unwarranted interactions between them. Millions of queries have been processed by this system while you've been reading this article. Some ideas, though, cannot be tested through randomized experiments. Treatment might be self-selected, for instance, or an experiment might incur too much damage to user experience. This is where observational approaches to causal inferences are particularly useful.
The observational fallback option for causal inference
Observational techniques allow us to estimate counterfactuals in the absence of an experiment, provided that we can convincingly control for other factors that might explain an observed effect. Propensity scores, instrumental variables, and synthetic controls are all methods for estimating counterfactuals when randomized treatment is not an option.
Setting aside their statistical intricacies, randomized experiments and observational approaches generally work well in the world of small data, where we can reason about modeling assumptions and inspect our data visually. Today's reality, however, is a world of big data. It's a challenge and a promising opportunity — the availability of large amounts of data holding enormous value if only we had a key to make sense of them. Causal inference at scale may be one such key.
What if app developers could understand which new features drive downloads? If YouTube creators could see which videos lead to most subscriptions? If advertisers could measure which campaigns or creatives simply don't work? What if causal inference, whether based on experiments or based on observational data, wasn't limited to small-sample counterfactuals but could be carried out at scale?
Automating causal attribution
Two things limit the application of our existing algorithms. First, how can we design causal methods that work at high levels of automation? And second, how do we extend our models to accomplish fine-grained attribution at scale? Let's take a look at both challenges.
Traditionally, estimating causal effects tends to involve a lengthy thought process. Is a randomized experiment possible? If not, can we use observational data while effectively controlling for confounders? The statistical methods for estimating counterfactuals are fairly well-developed and have been described in an extensive literature (see Rubin, Pearl, Angrist & Pischke, or Imbens & Rubin for recent examples). But automating such analyses is new territory. How do we decide on the best approach, build models, run power analyses and diagnostics, check the sensitivity of our results, and take action, all automatically and across millions or billions of instances?
It's a long-term research program in its early stages. One example of the steps we've taken at Google has been the development of CausalImpact, a synthetic-matching approach to automatically estimating causal effects from time-series data when a randomized experiment is not available. The model underlying CausalImpact is a structural time-series model, that is, a state-space model for time-series data. Like all state-space models, it rests on two simple equations:
\[y_t = Z^T_t \alpha_t + \varepsilon_t \\
\alpha_{t+1} = T_t \alpha_t+R_t \eta_t \]
The first equation expresses the observed data $y$ in terms of a linear combination of latent states plus observation noise. The second equation describes how these latent states evolve over time. Incredibly rich models can be formulated using these two equations alone (see here for details).
How do we get from state-space dynamics to causal inference? By letting the model predict what would have happened in the past had we not launched that new feature. Had we not rolled out that new product to more countries. Had we not launched that new app. The figure below illustrates this. The vertical dotted line marks the beginning of our intervention. By subtracting what the model predicts in hindsight, $\hat{y}_t$ (dotted line in the top panel), from what we actually observed, $y_t$ (solid line in the top panel), we obtain an estimate of the effect our actions caused (bottom panel).
CausalImpact adopts a Bayesian approach. A spike-and-slab prior allows the model to select a suitable subset of covariates without overfitting the data, especially in problems of high cardinality. And the conservative random-walk behavior of the state variables is suitable for a wide variety of time series that automated systems may encounter, as long as we are confident that the conditions for obtaining valid causal estimates are satisfied. For example, the covariates must not themselves have been affected by the intervention, and the relationship between the outcome variable and the covariates must be stable over time. These are examples of the things we need to get right as we move towards automation in causal inference.
Causal attribution at a fine scale
There is, however, a second challenge besides automation. Randomized experiments and observational studies are typically designed to understand individual interventions — a feature launch, an advertising campaign, a video upload. In contrast, the data we would like to make sense of increasingly consists of massive streams of events and outcomes. Given a website visit, for example, we can no longer think of the 'last click' as the underlying causal event — a user might have visited the site anyway. Rather, we'll need to design models that attribute causal credit to a whole number of events, the combination of which led to the eventual outcome.
One prerequisite to fine-grained attribution is to measure outcomes more exhaustively than we have until more recently, for example through cross-device and offline conversions. But another task is to actually distribute credit to the underlying causative events. To take an analogy, the last move is rarely by itself causal for winning a game of chess. It's a whole sequence of steps that deserve credit (or blame). When each particular combination of events leading up to a user action is rare, though, we are dealing with incredibly sparse big data. Fine-grained attribution has been a persistent analytical headache, indicating that we have a long way to go in terms of making big data broadly useful in causal inference.
What would we gain from solving automatic and fine-grained causal inference? The answer is straightforward — a way of determining just how much each impression, click, or download contributed to the desired outcome, such as a website visit, an app download, or an account sign-up. A way of assessing, therefore, how much value each of these events provided, and to suggest how limited resources should be spent to provide the highest marginal return.
In a world of big data, our ambition is no longer to answer just one causal question. We want to solve all attribution problems — every day, instantly. We might well learn more about causality at scale in the next 10 years than we have in the past 100. And witness the emergence of new data science paradigms along the way.
Comments
Post a Comment